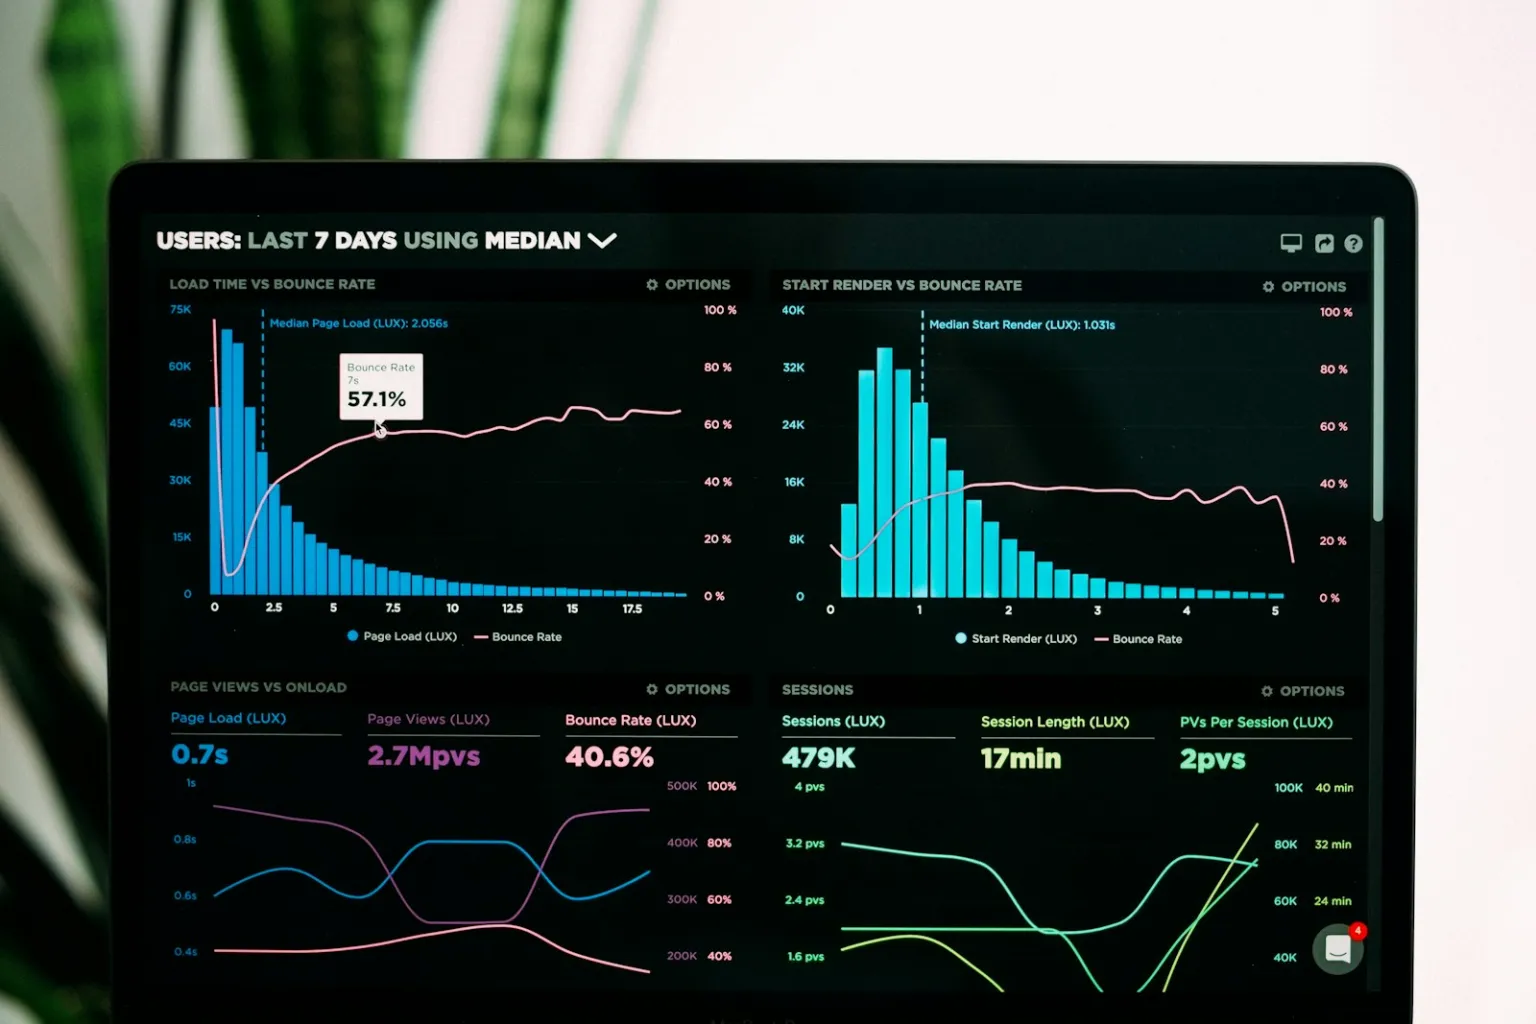
A sales dashboard built from your spreadsheets shows your most important sales numbers on one screen and updates without anyone copying data by hand. To build one, choose a few numbers that drive decisions, clean and connect the sheets they come from, pick a tool your team already opens, and set an automatic refresh.
Many teams have the data already. It just lives in an export from the store, a CRM sheet and a finance file that someone combines every week. This guide shows how to turn that into a dashboard people actually use.
Start with the questions, not the charts
Before you pick a tool, write down the three to five questions the dashboard must answer. For example:
- Are we on track for this month’s sales target?
- Which products or services sell most, and which are slowing down?
- Where do new customers come from?
- How full is the pipeline for next month?
- Which salesperson or channel needs attention?
Each question becomes one section of the dashboard. If a chart does not answer a question someone asks, leave it out.
Which numbers to show
Pick a small set. Common sales dashboard numbers include:
- Revenue for the period, compared with the target and the same period before.
- Number of orders or deals closed.
- Average order or deal value.
- Pipeline value by stage, if you track deals.
- Conversion rate from lead to customer, or from visit to order.
- Top products, services or customers.
- Sales by channel or region.
Define each number in writing. “Revenue” can mean before or after refunds, with or without tax. If two people read the same number differently, the dashboard causes arguments instead of decisions.
Get the sources ready
Dashboards break when the data underneath is messy. Check each spreadsheet:
- One row per record. One order, one deal or one customer per row, not merged cells or subtotals in the middle.
- Consistent columns. Same column names and order every time the file is exported.
- Clean values. One date format, one spelling per product and channel, numbers stored as numbers.
- A shared key. A customer ID or email that links the CRM sheet to the orders sheet.
If your sheets need a deep clean first, our data cleaning service handles that, and spreadsheet automation can stop the mess from coming back.
Choose a tool
The best tool is the one your team already opens every day.
- Inside your spreadsheet tool. Charts and pivot tables on a separate tab. Simple and familiar, fine for small teams.
- A business intelligence tool. Looker Studio, Power BI and similar tools connect to sheets and other sources, handle filters well and are easy to share.
- Your CRM or store’s built-in reports. Good if most data already lives there.
- A custom dashboard. For teams that need it inside their own app or portal.
Think about who needs access, on which devices, and whether people outside the company should see it.
Set the refresh
A dashboard that needs manual updating will go stale. Decide:
- How fresh it must be. Daily is enough for most sales teams. Hourly only if decisions happen that fast.
- Where data comes from. Connect directly to the live sheet or the source tool, instead of uploading copies.
- Who gets alerted. If a refresh fails, someone should know before the Monday meeting.
Add a “last updated” time on the dashboard so everyone can see how current it is.
A simple layout that works
If you are not sure where to start, this layout suits most small sales teams:
- Top row: four number tiles. Revenue this month against target, deals or orders closed, average value, and conversion rate. Each shows the change from last month.
- Second row: a line chart of revenue by week, with the target as a dotted line.
- Third row: a bar chart of sales by product or service, and a bar chart by channel.
- Bottom: a short table of the largest open deals or the top customers this month.
- Filters: date range, salesperson and region, placed at the top where everyone can find them.
Read top to bottom, it answers “Are we on track?”, then “Why?”, then “What should we chase next?”. Add more pages only when someone asks a question the main page cannot answer.
Sales dashboard mistakes to avoid
- Too many charts. If people scroll for a minute, they stop looking. Keep the main view to one screen.
- No targets. A number without a target or comparison does not tell you whether it is good.
- Undefined metrics. Write down how each number is calculated.
- Pie charts with many slices. Use bar charts for comparisons.
- Building on dirty data. Clean first, chart second.
- No owner. Someone must check it still works when a source sheet changes.
How we build one
At Wooprex, AI maps your spreadsheets, suggests the data model and drafts the dashboard layout from the questions you list. An analyst then checks every number against your source data, fixes calculation errors, and tests the refresh before handover. You get the dashboard, a short note defining each metric, and instructions for adding new data.
Dashboards are quoted on the brief with a fixed price before work starts. See dashboards for what is included, or the wider Data & Research service line.
FAQ
Do I need to move my data out of spreadsheets?
No. Many dashboards connect straight to the sheets you already use. Moving to a database helps only when the files get very large or many people edit them.
How many numbers should a sales dashboard show?
Five to eight on the main view is a practical range. Add detail pages for people who need to dig deeper.
Can the dashboard combine data from my store and my CRM?
Yes, as long as the two sources share a key, such as customer email or order ID, that links the records.
How often should it refresh?
Daily works for most sales teams. Set it to match how often you make decisions from it.
Want to stop building the same sales report every week? Start a Task and get a fixed price within 6 business hours.